

A few months back, I worked on building an observability solution for data pipelines 🛠. Observability of data pipelines helps determine completeness, accuracy, efficiency and consistency for any data uploaded through either batch or streaming sources.
There was the use case where I had to get the count of messages published in a pub/sub topic for streaming sources. I was exploring various ways to achieve this, and one of the quickest ways I found was using Stackdriver. 🚀
What is Stackdriver?
Google Stackdriver is a suite of tools that facilitates monitoring, analyzing and debugging your cloud-powered applications. It provides visibility into your applications’ performance, availability, and health and infrastructure.
Stackdriver provides tools for collecting logs, metrics, and alerts and provides visibility into the cloud environment with charts, a dashboard, service-level objective monitoring and uptime checks. It is integrated with other Google cloud products. Logs and metrics from Pub/Sub, Compute, GKE, etc., are available on Stackdriver.
What is Google cloud monitoring API?
You can consume Stackdriver metrics programmatically with Google Cloud Monitoring API using its REST & gRPC interface. Google also provide client libraries for different languages to easily integrate with the API.
How to use this API?
We can use metric names and labels to query for time series or we can use Metric Query Language (MQL) for advance querying in our code. Let’s discuss some terminologies before getting deep dive into our demo.
Metrics:
Collection of measurements that determines the performance of your application and system services. There are 1500 metrics that Stackdriver provides.
Resource:
It is a monitored component for which Stackdriver collector collects metrics. Example of a resource: Pub/Sub topic, a Compute instance.
Timeseries:
Metrics and resource tags describe a timeseries. It contains measurements of the resource for time intervals.
Using operators and aggregations we can transform the raw timeseries data into a form suitable for our use case. For example, we might be interested in calculating the average CPU usage of Compute instances over a period of the day.
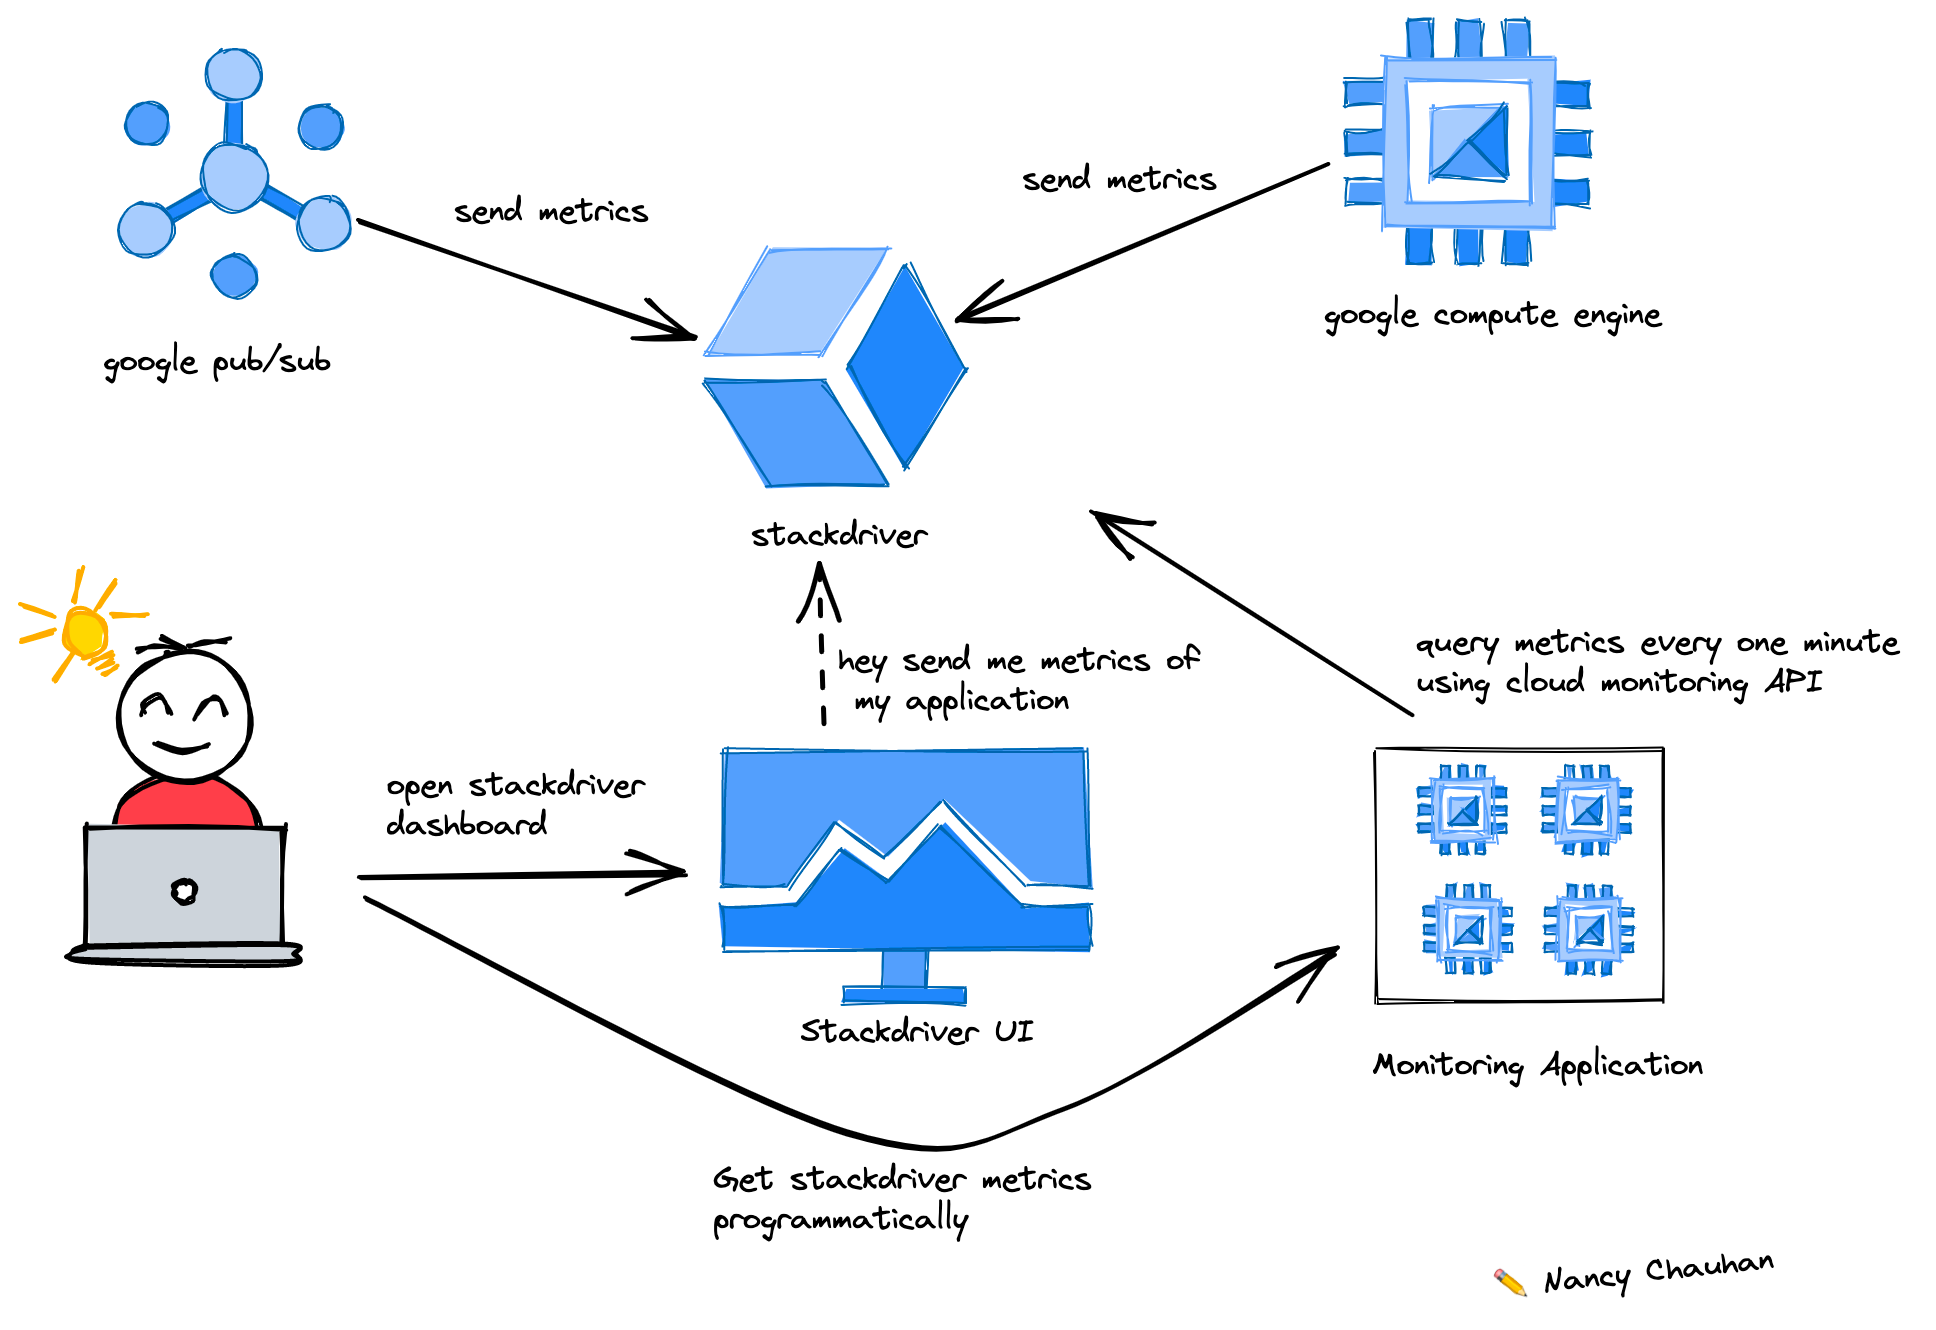
Let’s build it 🔨
We are going to develop a Java application that reads a number of messages in a Pub/Sub topic. The illustration below describes what we are trying to achieve.
I have built the project and pushed the code on Github. Let’s understand how it works!
https://github.com/Nancy-Chauhan/stackdriver-example

Here we are querying the published messages to multiple Pub/Sub topics that match a regex aggregated over the period of a day. It gives us a list of timeseries that matches the query. Using the value from the timeseries we can perform some interesting actions!

This will print the message count for each topic that matches the query.
Here is the output 💻:

What can we do with it?
Once you have the raw values we can use them to :
- Building Kubernetes operator that auto-scales pods based on publish rate of messages.
- Autoscaling VMs based on publish rate of messages.
- Consuming metrics directly to show in a reporting dashboard to your clients, laying the foundation for more transparency/observability for your clients. ✨
- Building custom alerting tooling.

